CRDDS Method of the Month
GIS: Introduction
MOTM GIS Miniseries:
All mini-workshops Tuesdays 12:00 to 12:30 pm
In-Depth Workshops:
Tuesdays 12:00 to 2:00 pm
Nov 13: GIS Day
Outline
- What is "GIS"?
- What is "Geospatial Data"?
- Core Concepts
- Common Techniques
Do you have a favorite mapping or GIS project?
Drop it in the chat!
What is GIS?
We're surrounded by GIS
GIS:
(Geographic Information System) An integrated collection of computer software and data used to view and manage information about geographic places, analyze spatial relationships, and model spatial processes.
John Snow & Cholera: The classic GIS example
John Snow & Cholera:
- John Snow: physician, anesthesiologist, founder of modern epidemiology
- London cholera outbreak of 1854
- Analyzed patterns of the outbreak to locate epicenter
- Discovered well at epicenter; removed well handle, outbreak stops
But not just any old data...
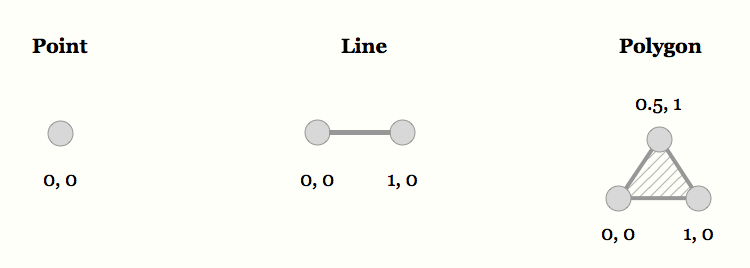
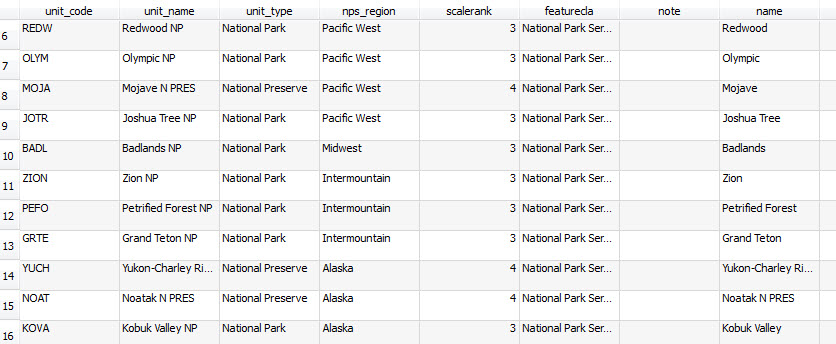
Geospatial Data!
5 Things:
- Points
- Lines
- Polygons
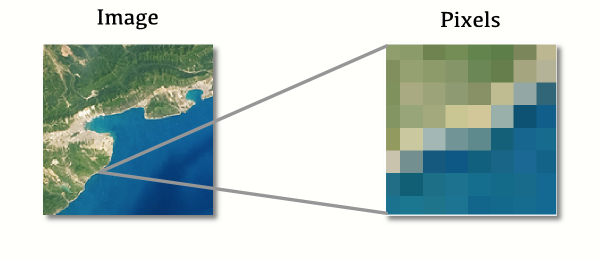
- Pixels/Cells
- And their associated attributes
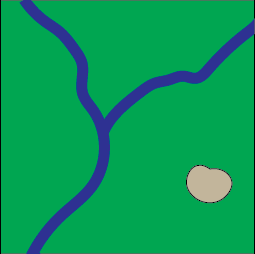
Vector Data
Raster Data
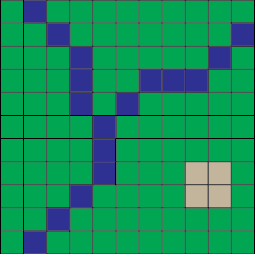
And their attributes...
Cells have values, aka attributes
Digital Elevation Model
(DEM)
- White Cell = 2402.89m
- Black Cell = 1735.06m
More on data in 2 weeks!
Finding GIS Data Sept 22
But... putting stuff on a map is more compicated than it seems...
2 Things:
- Datums
- Projections
Because Earth's shape is irregular and changing, assigning locations is imperfect.
We use imaginary reference systems to approximate.
We tend to call this a "datum."
You might consider the datum to be the "grid",
like latitude and longitude.
Projection, or how we warp the grid
Projection
Mercator Projection
Good for direction
Bad for shape/size
(Hello Greenland!)
Gall-Peters Projection
Learn more about mapping stuff in 3 weeks!
Map Design Sept 29
What can I do with GIS?
Take some data...
Do some stuff...
Communicate new info!
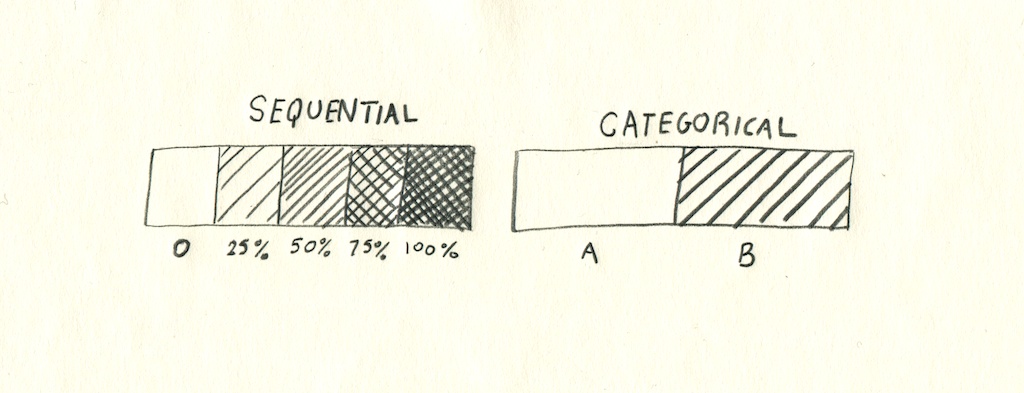
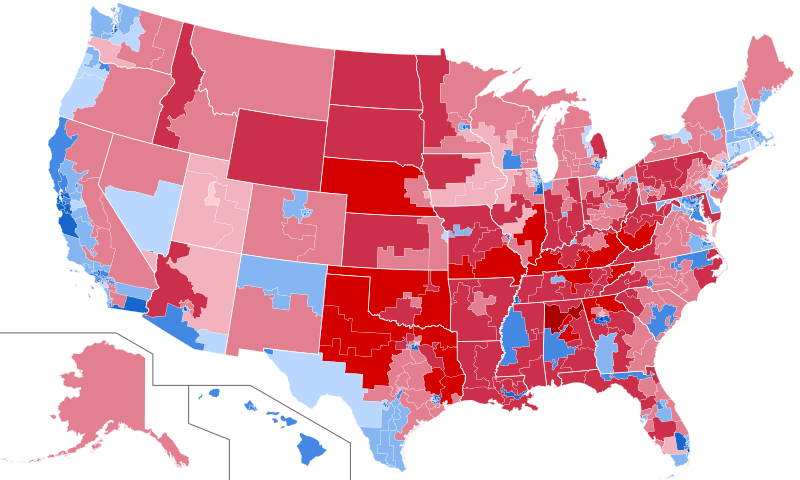
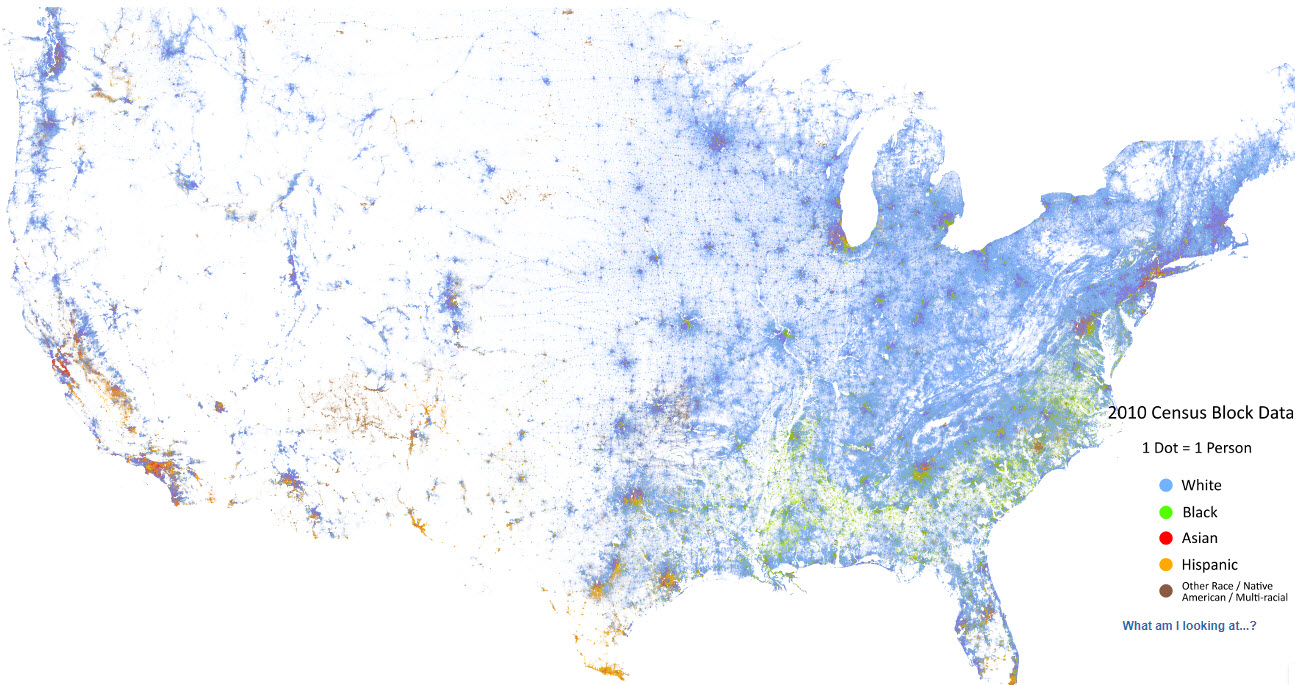
Stuff we do:
Symbolize
Aggregate
Measure
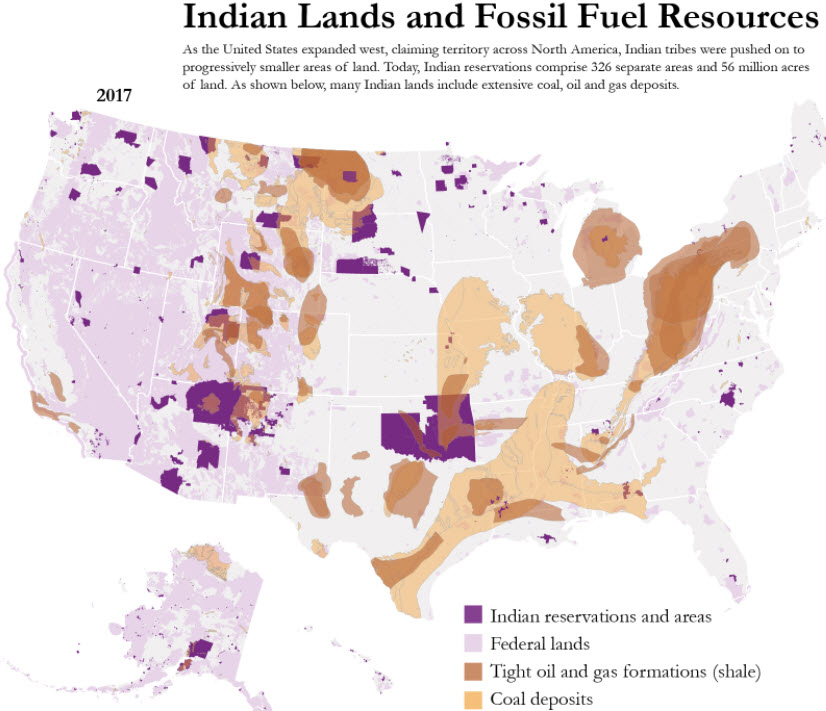
Overlay
Interpolate
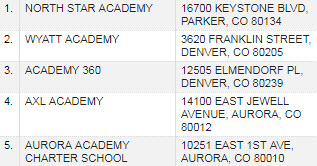
Geocode
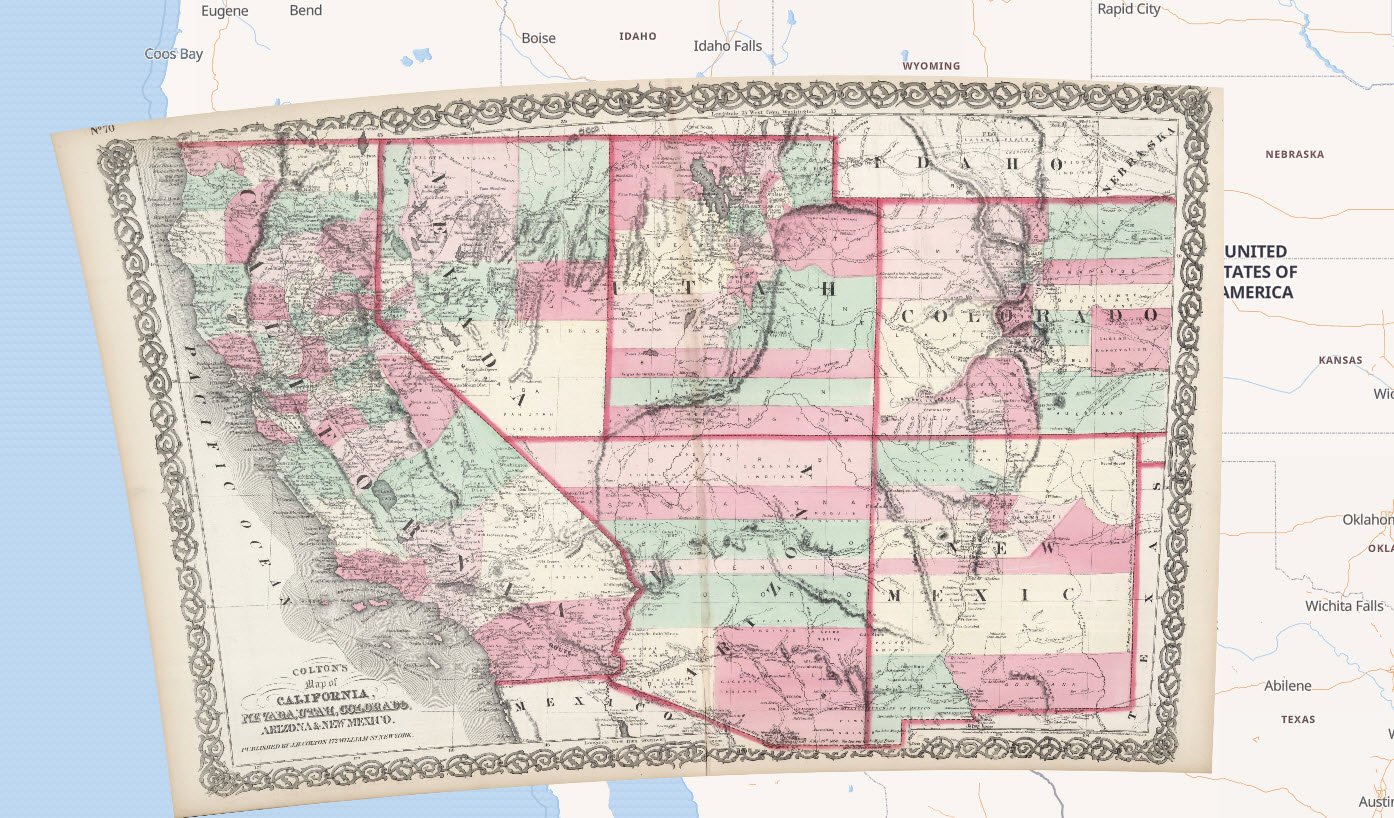
Georeference
Symbolization
.svg)
Overlay
Georeference
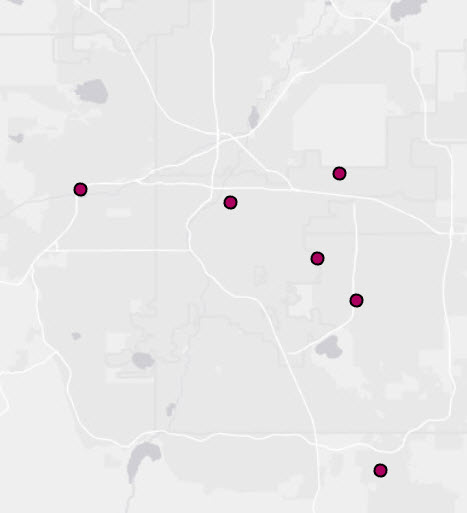
Geocode
How do I do all this fun GIS stuff?
Learn more about GIS tools and software next week!
Tools for GIS Sept 15
Thank you
Upcoming:
Contact:
- Email: philip.white@colorado.edu
- Appointment: bit.ly/phil-appt
- Tutorials: outpw.github.io/tutorials/GISmini